Misc
Mapping the Price of Beer Around the World
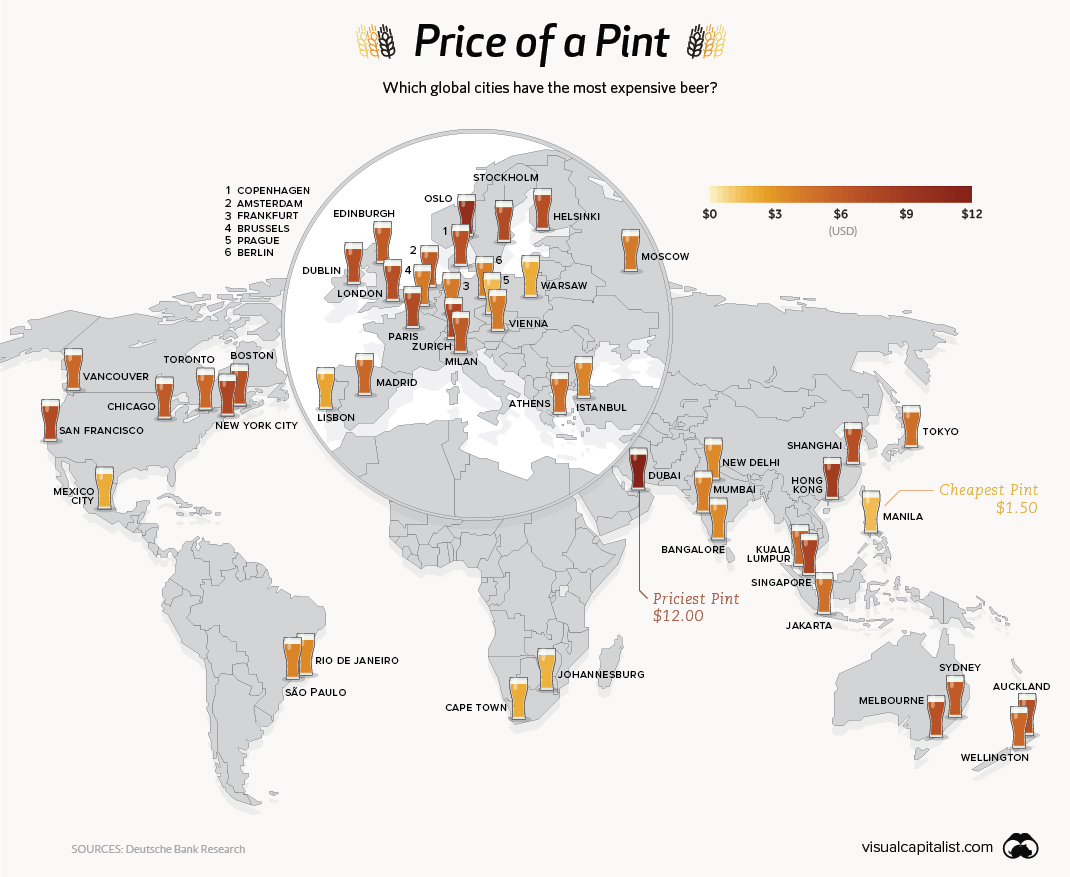


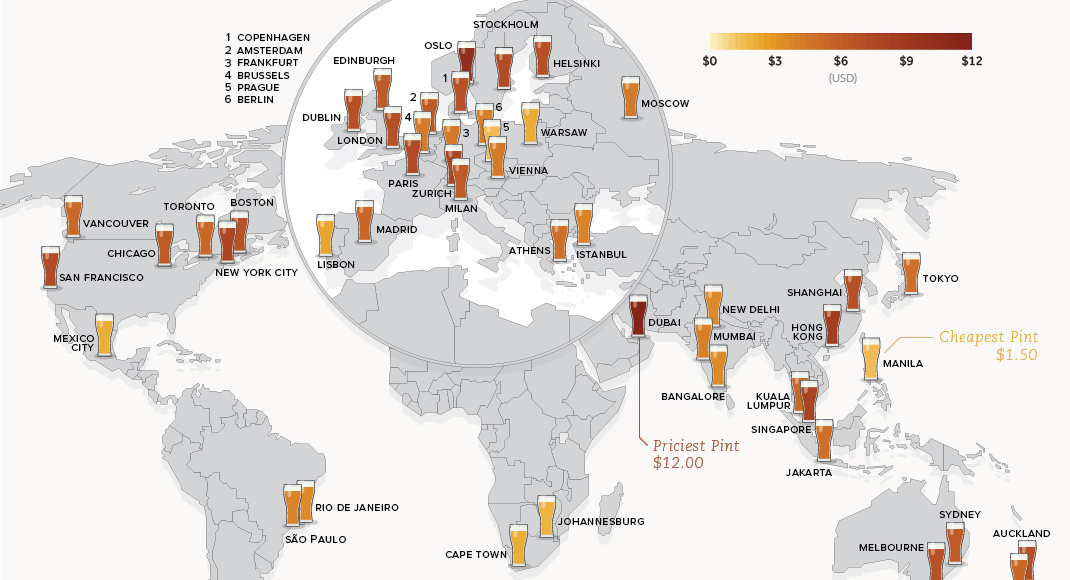
Mapping the Price of Beer Around the World
Whether you’re sipping a pint of kölsch in Germany or drinking a Heineken at a hotel bar in Hong Kong, there are a number of factors that can influence how much your beverage will cost. Cost of living is certainly a primary factor, but taxes, availability, type of establishment, type of beer (craft beer vs macro brew), and local tastes will also affect the price of your pint.
Analysts at Deutsche Bank recently gathered critical data on how much a pint of beer costs in various major cities around the world.
Sticker Shock
Many of the cities that topped the price list have a higher cost of living, and it’s no surprise to see Singapore and Oslo rank near the top.
The city of Dubai, however, is a unique case.
Technically, drinking is only permissible for expats and non-Muslim residents in Dubai, and being drunk in public can come with serious consequences. That said, the city’s establishments serve beer with prices that reflect its high-end look and feel. Considering the scarcity and heavy regulations, those craving a pint might be happy to overlook the price tag of $12.
Cheap Thrills
The thirsty citizens of the Czech Republic consume the most beer by a long shot – a full 36% more than neighbors Austria and Germany. This is partially because demand is so high that companies are willing to compete on cost. As a result, beer is often cheaper than water in restaurants and pubs in Prague.
Manila’s low cost of living and steady supply of domestic beer earned it the lowest price per pint on the Beer Price List. San Miguel, the Philippines’ largest brewery, dominates with a market share of over 90%, and beer consumption is also on the rise in the country.
The 48 Pack
The median price of beer in the 48 cities analyzed was $5.70, and below is the full list of cities ordered from most to least expensive pint.
| Rank | City | Country | Price of Beer Pint |
|---|---|---|---|
| #1 | Dubai | United Arab Emirates | $12.00 |
| #2 | Oslo | Norway | $10.30 |
| #3 | Hong Kong | China | $8.90 |
| #4 | Singapore | Singapore | $8.30 |
| #5 | Zurich | Switzerland | $7.70 |
| #6 | New York City | United States | $7.70 |
| #7 | San Francisco | United States | $7.70 |
| #8 | Paris | France | $7.30 |
| #9 | Stockholm | Sweden | $7.30 |
| #10 | London | United Kingdom | $7.20 |
| #11 | Dublin | Ireland | $7.10 |
| #12 | Helsinki | Finland | $7.10 |
| #13 | Auckland | New Zealand | $7.00 |
| #14 | Shanghai | China | $7.00 |
| #15 | Melbourne | Australia | $6.80 |
| #16 | Copenhagen | Denmark | $6.70 |
| #17 | Boston | United States | $6.70 |
| #18 | Milan | Italy | $6.50 |
| #19 | Amsterdam | Netherlands | $6.10 |
| #20 | Sydney | Australia | $6.10 |
| #21 | Edinburgh | United Kingdom | $6.00 |
| #22 | Chicago | United States | $5.70 |
| #23 | Madrid | Spain | $5.70 |
| #24 | Toronto | Canada | $5.70 |
| #25 | Wellington | New Zealand | $5.70 |
| #26 | Vancouver | Canada | $5.50 |
| #27 | Kuala Lumpur | Malaysia | $5.40 |
| #28 | Athens | Greece | $5.10 |
| #29 | Jakarta | Indonesia | $5.00 |
| #30 | Tokyo | Japan | $5.00 |
| #31 | Moscow | Russia | $4.70 |
| #32 | Vienna | Austria | $4.60 |
| #33 | Frankfurt | Germany | $4.60 |
| #34 | Brussels | Belgium | $4.50 |
| #35 | Mumbai | India | $3.90 |
| #36 | Berlin | Germany | $3.90 |
| #37 | São Paulo | Brazil | $3.70 |
| #38 | Istanbul | Turkey | $3.70 |
| #39 | New Delhi | India | $3.40 |
| #40 | Bangalore | India | $3.20 |
| #41 | Rio de Janeiro | Brazil | $3.20 |
| #42 | Lisbon | Portugal | $2.80 |
| #43 | Warsaw | Poland | $2.60 |
| #44 | Cape Town | South Africa | $2.60 |
| #45 | Mexico City | Mexico | $2.40 |
| #46 | Johannesburg | South Africa | $2.20 |
| #47 | Prague | Czech Republic | $1.60 |
| #48 | Manila | Philippines | $1.50 |
It’s worth noting that the data collection focuses on expat (read: touristy) areas of the city. While that’s not a perfect picture of prices in a city, it does allow for a more consistent comparison of wildly differing markets.


VC+
VC+: Get Our Key Takeaways From the IMF’s World Economic Outlook
A sneak preview of the exclusive VC+ Special Dispatch—your shortcut to understanding IMF’s World Economic Outlook report.

Have you read IMF’s latest World Economic Outlook yet? At a daunting 202 pages, we don’t blame you if it’s still on your to-do list.
But don’t worry, you don’t need to read the whole April release, because we’ve already done the hard work for you.
To save you time and effort, the Visual Capitalist team has compiled a visual analysis of everything you need to know from the report—and our VC+ Special Dispatch is available exclusively to VC+ members. All you need to do is log into the VC+ Archive.
If you’re not already subscribed to VC+, make sure you sign up now to access the full analysis of the IMF report, and more (we release similar deep dives every week).
For now, here’s what VC+ members get to see.
Your Shortcut to Understanding IMF’s World Economic Outlook
With long and short-term growth prospects declining for many countries around the world, this Special Dispatch offers a visual analysis of the key figures and takeaways from the IMF’s report including:
- The global decline in economic growth forecasts
- Real GDP growth and inflation forecasts for major nations in 2024
- When interest rate cuts will happen and interest rate forecasts
- How debt-to-GDP ratios have changed since 2000
- And much more!

Get the Full Breakdown in the Next VC+ Special Dispatch
VC+ members can access the full Special Dispatch by logging into the VC+ Archive, where you can also check out previous releases.
Make sure you join VC+ now to see exclusive charts and the full analysis of key takeaways from IMF’s World Economic Outlook.
Don’t miss out. Become a VC+ member today.
What You Get When You Become a VC+ Member
VC+ is Visual Capitalist’s premium subscription. As a member, you’ll get the following:
- Special Dispatches: Deep dive visual briefings on crucial reports and global trends
- Markets This Month: A snappy summary of the state of the markets and what to look out for
- The Trendline: Weekly curation of the best visualizations from across the globe
- Global Forecast Series: Our flagship annual report that covers everything you need to know related to the economy, markets, geopolitics, and the latest tech trends
- VC+ Archive: Hundreds of previously released VC+ briefings and reports that you’ve been missing out on, all in one dedicated hub
You can get all of the above, and more, by joining VC+ today.

-

 Mining1 week ago
Gold vs. S&P 500: Which Has Grown More Over Five Years?
-

 Markets2 weeks ago
Ranked: The Most Valuable Housing Markets in America
-

 Money2 weeks ago
Which States Have the Highest Minimum Wage in America?
-

 AI2 weeks ago
Ranked: Semiconductor Companies by Industry Revenue Share
-

 Markets2 weeks ago
Ranked: The World’s Top Flight Routes, by Revenue
-

 Countries2 weeks ago
Population Projections: The World’s 6 Largest Countries in 2075
-

 Markets2 weeks ago
The Top 10 States by Real GDP Growth in 2023
-

 Demographics2 weeks ago
The Smallest Gender Wage Gaps in OECD Countries