Politics
How Much Do Countries Spend on Healthcare Compared to the Military?
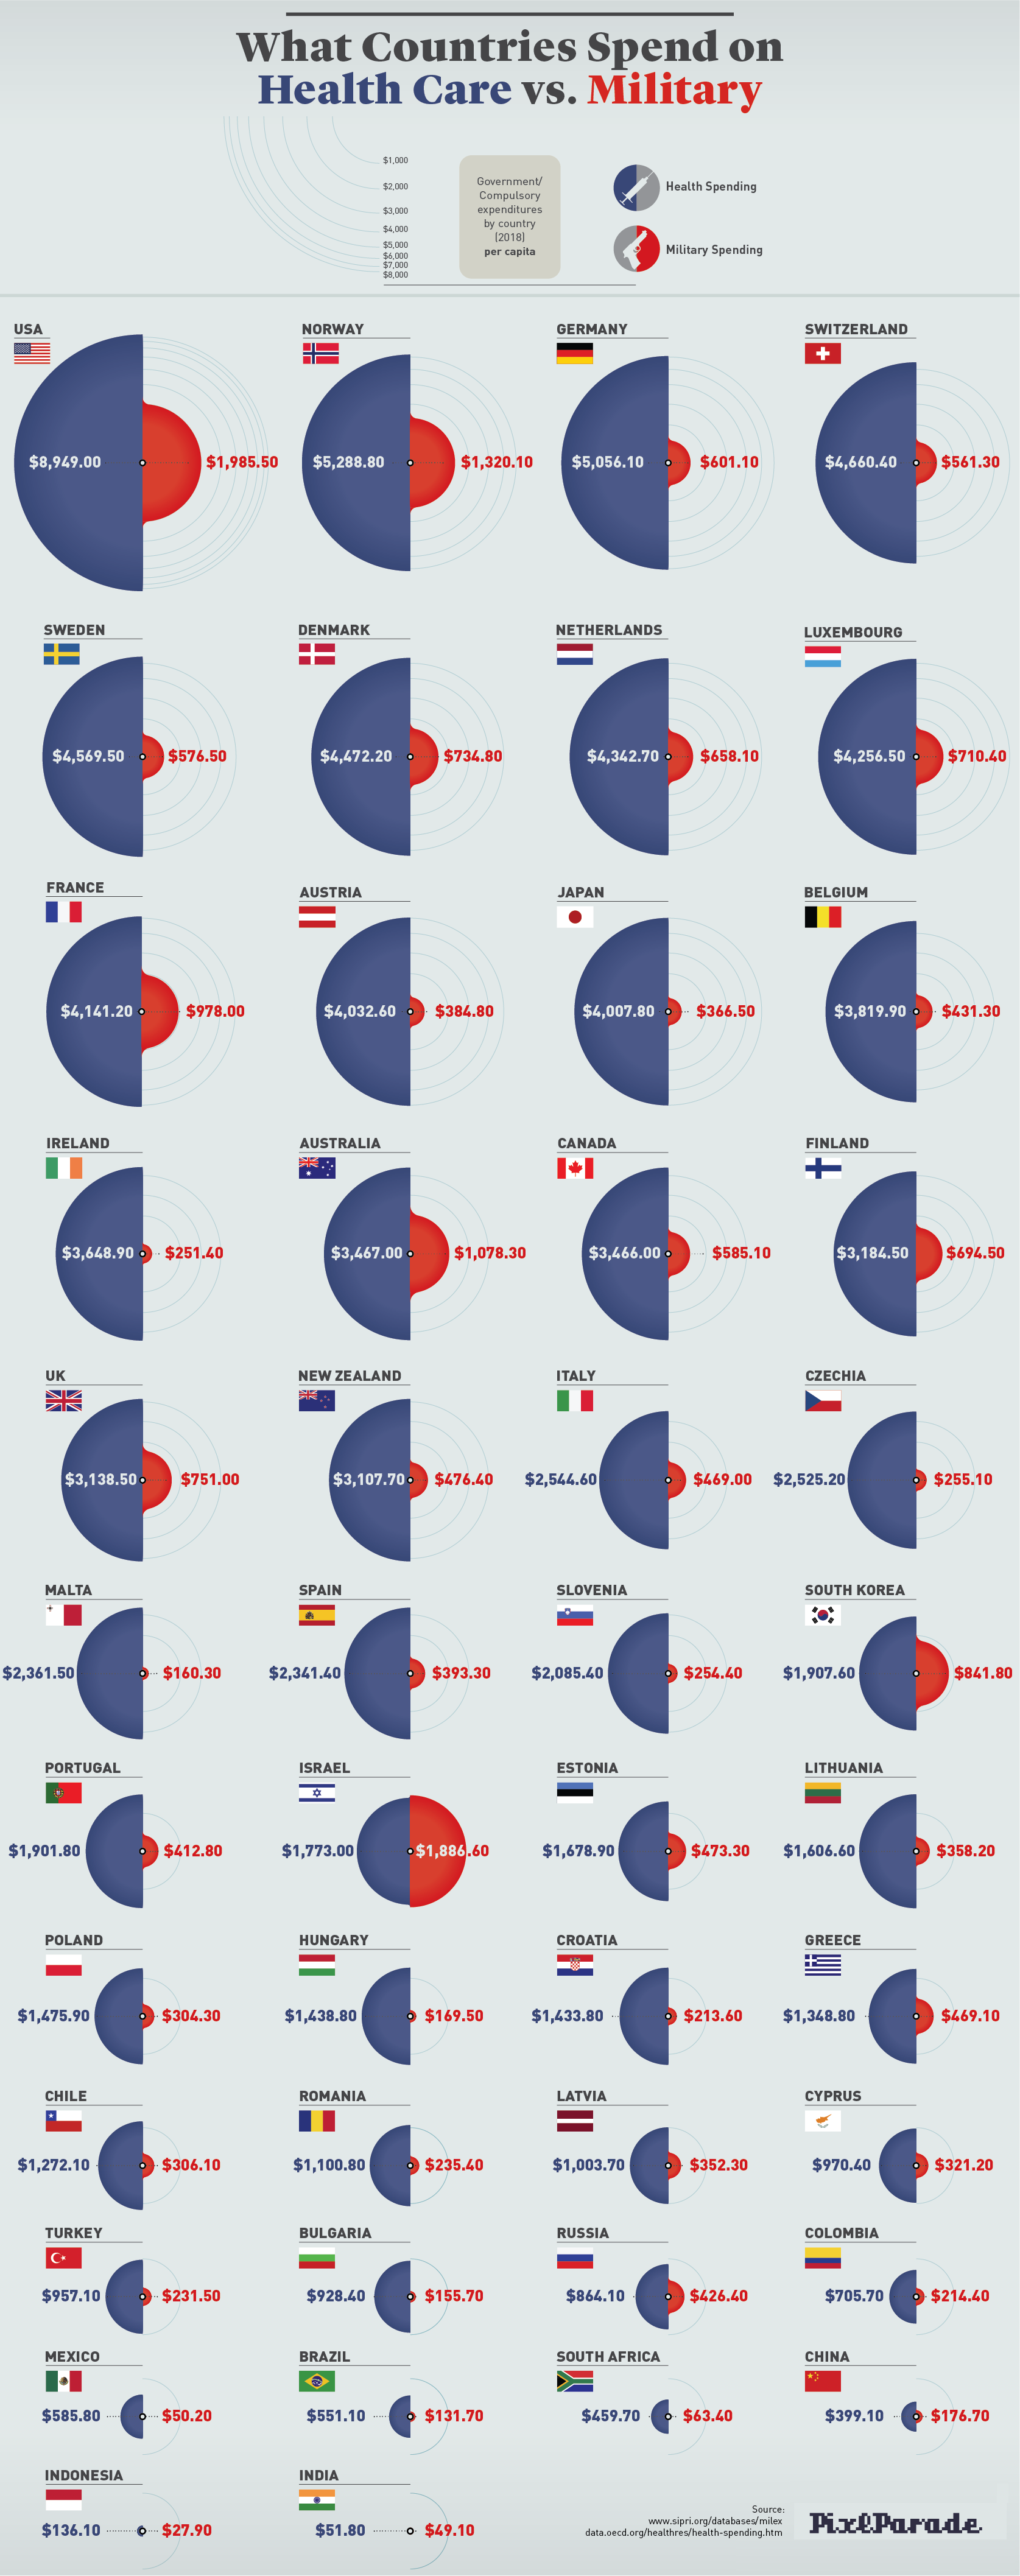
Healthcare vs. Military Spending, by Country
Keeping citizens both healthy and secure are key priorities for many national governments around the world—but ultimately, decisions must be made on how tax dollars are spent to accomplish these objectives, and funding must fall into one bucket or another.
This infographic from PixlParade examines how much 46 different countries put towards healthcare and military spending in 2018, per capita.
Head to Head: Healthcare versus Military
Data for government and compulsory healthcare spending comes from the Organization for Economic Co-operation and Development (OECD). Note that these figures do not include spending through private insurance or out-of-pocket expenses.
Meanwhile, the data for military spending comes from the Stockholm International Peace Research Institute (SIPRI).
| Country | Health spending (Per capita, 2018 US$) | Military spending (Per capita, 2018 US$) |
|---|---|---|
| U.S. | $9,008.77 | $2,086.50 |
| Norway | $5,361.00 | $1,323.90 |
| Germany | $5,262.83 | $559.50 |
| Switzerland | $4,687.26 | $546.00 |
| Sweden | $4,623.68 | $574.90 |
| Netherlands | $4,461.30 | $651.50 |
| Denmark | $4,441.07 | $792.50 |
| Luxembourg | $4,385.66 | $650.80 |
| France | $4,310.55 | $791.00 |
| Austria | $4,137.25 | $381.00 |
| Belgium | $3,868.82 | $421.60 |
| Japan | $3,787.74 | $366.50 |
| Canada | $3,719.86 | $613.10 |
| Ireland | $3,629.43 | $229.80 |
| UK | $3,336.55 | $743.10 |
| Finland | $3,331.65 | $680.30 |
| Australia | $3,311.33 | $1,078.00 |
| NZ | $3,188.39 | $532.30 |
| Czhechia | $2,632.67 | $254.10 |
| Italy | $2,574.96 | $458.70 |
| Malta | $2,448.73 | $152.20 |
| Spain | $2,414.69 | $381.70 |
| Slovenia | $2,227.77 | $254.80 |
| Portugal | $1,906.23 | $431.00 |
| South Korea | $1,848.76 | $841.70 |
| Israel | $1,828.40 | $2,357.50 |
| Estonia | $1,744.57 | $458.60 |
| Lithuania | $1,599.15 | $377.10 |
| Croatia | $1,553.67 | $232.50 |
| Poland | $1,511.18 | $317.50 |
| Hungary | $1,493.01 | $184.60 |
| Romania | $1,344.34 | $223.50 |
| Greece | $1,331.19 | $547.10 |
| Chile | $1,282.59 | $296.10 |
| Latvia | $1,111.67 | $375.20 |
| Cyprus | $1,103.03 | $374.30 |
| Bulgaria | $1,042.85 | $136.30 |
| Turkey | $946.83 | $238.60 |
| Russia | $873.00 | $421.20 |
| Colombia | $864.16 | $204.10 |
| Mexico | $582.05 | $46.30 |
| Brazil | $388.98 | $134.50 |
| South Africa | $267.85 | $63.50 |
| China | $249.83 | $177.60 |
| Indonesia | $55.62 | $28.20 |
| India | $18.80 | $49.00 |
| Source: OECD | Source: SIPRI |
Note: There are minor discrepancies in comparing table data to original sources due to recent estimate updates. Figures for Brazil, South Africa, China, Indonesia, and India come from the World Bank (2017).
The Top 10 Healthcare Spenders
The U.S. leads the world in government healthcare spending at $9,008 per capita – over 1.5 times that of Norway, the next-highest country examined.
| Country | Per capita health spending | % of GDP | % of health spending |
|---|---|---|---|
| U.S. | $9,008.77 | 14.3% | 84.7% |
| Norway | $5,361.00 | 8.6% | 85.3% |
| Germany | $5,262.83 | 9.7% | 84.6% |
| Switzerland | $4,687.26 | 7.6% | 64.4% |
| Sweden | $4,623.68 | 9.3% | 85.1% |
| Netherlands | $4,461.30 | 8.2% | 82.1% |
| Denmark | $4,441.07 | 8.5% | 83.9% |
| Luxembourg | $4,385.66 | 4.4% | 84.1% |
| France | $4,310.55 | 9.4% | 83.6% |
| Austria | $4,137.25 | 7.7% | 74.7% |
While per-capita government spending on healthcare in the U.S. is the highest in the world, this has not necessarily brought about better outcomes (such as longer life expectancy) compared to other developed nations.
It’s also worth mentioning that the above figures do not cover all healthcare costs incurred by citizens, as they do not account for private insurance spending or out-of-pocket expenses. According to OECD data, these additional costs tend to be the highest in places like Switzerland and the United States.
The Top 10 Military Spenders
Israel has the highest rate of military spending per capita, and has the distinction of being the only country on this list to invest more in defense than in healthcare.
| Country | Per capita military spending | % of GDP | Total expenditure, US$M |
|---|---|---|---|
| Israel | $2,357.50 | 5.3% | $19,759M |
| U.S. | $2,086.50 | 3.3% | $682,491M |
| Norway | $1,323.90 | 1.6% | $7,067M |
| Australia | $1,078.00 | 1.9% | $26,840M |
| South Korea | $841.70 | 2.5% | $43,070M |
| Denmark | $792.50 | 1.3% | $4,559M |
| France | $791.00 | 1.3% | $51,410M |
| UK | $743.10 | 1.8% | $49,892M |
| Finland | $680.30 | 1.4% | $3,757M |
| Netherlands | $651.50 | 1.2% | $11,115M |
Although the United States comes in second place here as well, in absolute terms, the U.S. puts more money into military expenditures than many other countries combined, at almost $700 billion per year.


United States
Charted: Trust in Government Institutions by G7 Countries
How much do you trust the government and its various institutions? We look at data for G7 countries for the time period of 2006-2023.


Trust in Government Institutions by G7 Countries
This was originally posted on our Voronoi app. Download the app for free on iOS or Android and discover incredible data-driven charts from a variety of trusted sources.
How much do you trust the government, and its various institutions?
It’s likely that your level of confidence probably depends on a wide range of factors, such as perceived competency, historical context, economic performance, accountability, social cohesion, and transparency.
And for these same reasons, trust levels in government institutions also change all the time, even in the world’s most developed countries: the G7.
Confidence in Government by G7 Countries (2006-2023)
This chart looks at the changes in trust in government institutions between the years 2006 and 2023, based on data from a multi-country Gallup poll.
Specifically, this dataset aggregates confidence in multiple national institutions, including the military, the judicial system, the national government, and the integrity of the electoral system.
| Country | Confidence (2006) | Confidence (2023) | Change (p.p.) |
|---|---|---|---|
| Canada | 57% | 64% | +7 |
| Britain | 63% | 63% | +0 |
| Germany | 55% | 61% | +6 |
| France | 54% | 60% | +6 |
| Japan | 48% | 59% | +11 |
| Italy | 41% | 54% | +13 |
| United States | 63% | 50% | -13 |
What’s interesting here is that in the G7, a group of the world’s most developed economies, there is only one country bucking the general trend: the United States.
Across most G7 countries, confidence in institutions has either improved or stayed the same between 2006 and 2023. The largest percentage point (p.p.) increases occur in Italy and Japan, which saw +13 p.p. and +11 p.p. increases in trust over the time period.
In the U.S., however, confidence in government institutions has fallen by 13 p.p. over the years. What happened?
Key Figures on U.S. Trust in Institutions
In 2006, the U.S. was tied with the UK as having the highest confidence in government institutions, at 63%.
But here’s where the scores stand in 2023, across various institutions:
| 🇺🇸 Institutions | Confidence (2023) |
|---|---|
| Military | 81% |
| Judiciary | 42% |
| National Government | 30% |
| Elections | 44% |
| Overall | 49% |
Based on this data, it’s clear that the U.S. lags behind in three key indicators: confidence in the national government, confidence in the justice system, and confidence in fair elections. It ranked in last place for each indicator in the G7.
One other data point that stands out: despite leading the world in military spending, the U.S. is only the third most confident in its military in the G7. It lags behind France (86%) and the United Kingdom (83%).

-

 Wealth6 days ago
Charted: Which City Has the Most Billionaires in 2024?
-

 Mining2 weeks ago
Gold vs. S&P 500: Which Has Grown More Over Five Years?
-

 Uranium2 weeks ago
The World’s Biggest Nuclear Energy Producers
-

 Education2 weeks ago
How Hard Is It to Get Into an Ivy League School?
-

 Debt2 weeks ago
How Debt-to-GDP Ratios Have Changed Since 2000
-

 Sports2 weeks ago
The Highest Earning Athletes in Seven Professional Sports
-

 Science2 weeks ago
Visualizing the Average Lifespans of Mammals
-

 Brands1 week ago
How Tech Logos Have Evolved Over Time