Misc
Mapping the Price of Beer Around the World


Mapping the Price of Beer Around the World
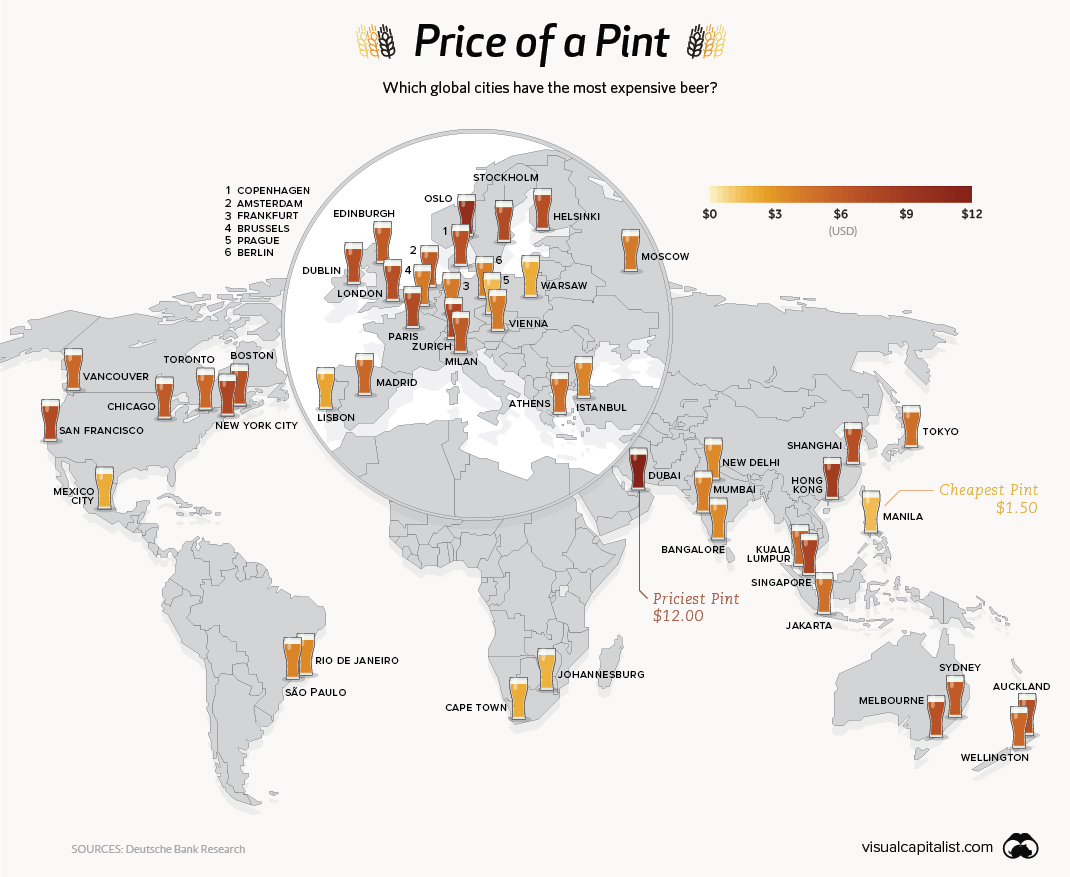
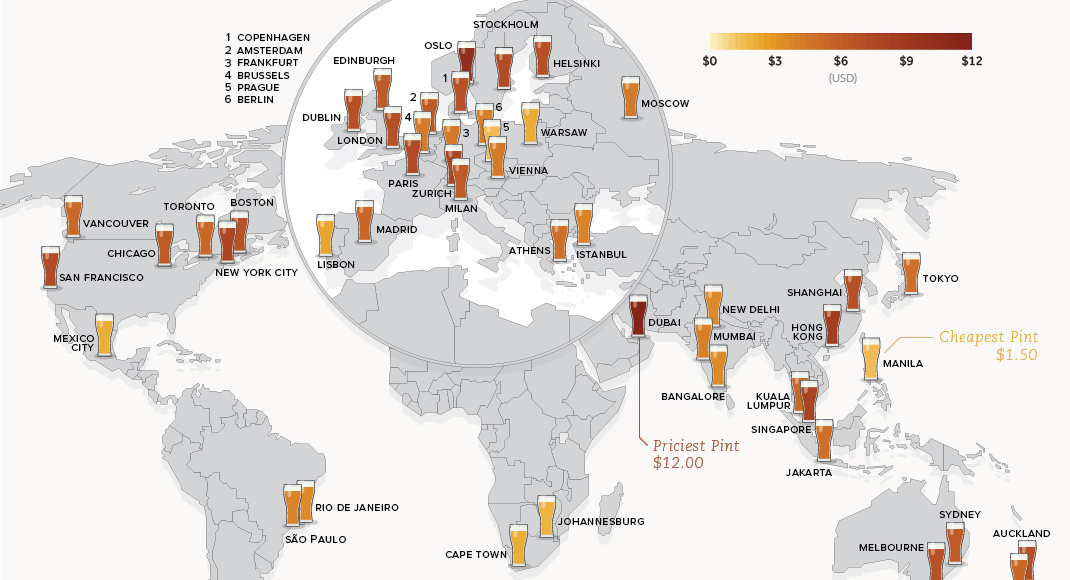
Whether you’re sipping a pint of kölsch in Germany or drinking a Heineken at a hotel bar in Hong Kong, there are a number of factors that can influence how much your beverage will cost. Cost of living is certainly a primary factor, but taxes, availability, type of establishment, type of beer (craft beer vs macro brew), and local tastes will also affect the price of your pint.
Analysts at Deutsche Bank recently gathered critical data on how much a pint of beer costs in various major cities around the world.
Sticker Shock
Many of the cities that topped the price list have a higher cost of living, and it’s no surprise to see Singapore and Oslo rank near the top.
The city of Dubai, however, is a unique case.
Technically, drinking is only permissible for expats and non-Muslim residents in Dubai, and being drunk in public can come with serious consequences. That said, the city’s establishments serve beer with prices that reflect its high-end look and feel. Considering the scarcity and heavy regulations, those craving a pint might be happy to overlook the price tag of $12.
Cheap Thrills
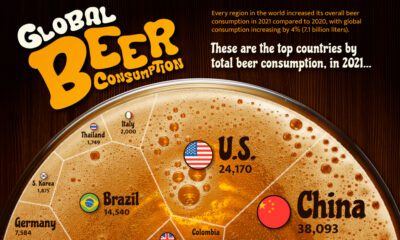
The thirsty citizens of the Czech Republic consume the most beer by a long shot – a full 36% more than neighbors Austria and Germany. This is partially because demand is so high that companies are willing to compete on cost. As a result, beer is often cheaper than water in restaurants and pubs in Prague.
Manila’s low cost of living and steady supply of domestic beer earned it the lowest price per pint on the Beer Price List. San Miguel, the Philippines’ largest brewery, dominates with a market share of over 90%, and beer consumption is also on the rise in the country.
The 48 Pack
The median price of beer in the 48 cities analyzed was $5.70, and below is the full list of cities ordered from most to least expensive pint.
| Rank | City | Country | Price of Beer Pint |
|---|---|---|---|
| #1 | Dubai | United Arab Emirates | $12.00 |
| #2 | Oslo | Norway | $10.30 |
| #3 | Hong Kong | China | $8.90 |
| #4 | Singapore | Singapore | $8.30 |
| #5 | Zurich | Switzerland | $7.70 |
| #6 | New York City | United States | $7.70 |
| #7 | San Francisco | United States | $7.70 |
| #8 | Paris | France | $7.30 |
| #9 | Stockholm | Sweden | $7.30 |
| #10 | London | United Kingdom | $7.20 |
| #11 | Dublin | Ireland | $7.10 |
| #12 | Helsinki | Finland | $7.10 |
| #13 | Auckland | New Zealand | $7.00 |
| #14 | Shanghai | China | $7.00 |
| #15 | Melbourne | Australia | $6.80 |
| #16 | Copenhagen | Denmark | $6.70 |
| #17 | Boston | United States | $6.70 |
| #18 | Milan | Italy | $6.50 |
| #19 | Amsterdam | Netherlands | $6.10 |
| #20 | Sydney | Australia | $6.10 |
| #21 | Edinburgh | United Kingdom | $6.00 |
| #22 | Chicago | United States | $5.70 |
| #23 | Madrid | Spain | $5.70 |
| #24 | Toronto | Canada | $5.70 |
| #25 | Wellington | New Zealand | $5.70 |
| #26 | Vancouver | Canada | $5.50 |
| #27 | Kuala Lumpur | Malaysia | $5.40 |
| #28 | Athens | Greece | $5.10 |
| #29 | Jakarta | Indonesia | $5.00 |
| #30 | Tokyo | Japan | $5.00 |
| #31 | Moscow | Russia | $4.70 |
| #32 | Vienna | Austria | $4.60 |
| #33 | Frankfurt | Germany | $4.60 |
| #34 | Brussels | Belgium | $4.50 |
| #35 | Mumbai | India | $3.90 |
| #36 | Berlin | Germany | $3.90 |
| #37 | São Paulo | Brazil | $3.70 |
| #38 | Istanbul | Turkey | $3.70 |
| #39 | New Delhi | India | $3.40 |
| #40 | Bangalore | India | $3.20 |
| #41 | Rio de Janeiro | Brazil | $3.20 |
| #42 | Lisbon | Portugal | $2.80 |
| #43 | Warsaw | Poland | $2.60 |
| #44 | Cape Town | South Africa | $2.60 |
| #45 | Mexico City | Mexico | $2.40 |
| #46 | Johannesburg | South Africa | $2.20 |
| #47 | Prague | Czech Republic | $1.60 |
| #48 | Manila | Philippines | $1.50 |
It’s worth noting that the data collection focuses on expat (read: touristy) areas of the city. While that’s not a perfect picture of prices in a city, it does allow for a more consistent comparison of wildly differing markets.


United States
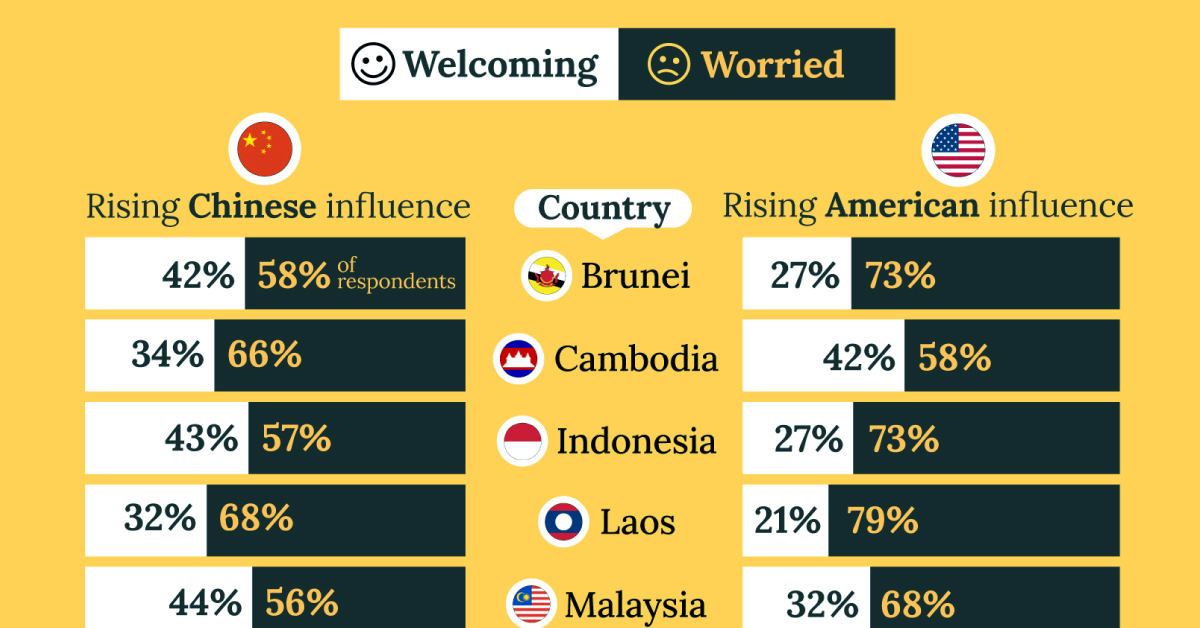
Charted: What Southeast Asia Thinks About China & the U.S.
A significant share of respondents from an ASEAN-focused survey are not happy about rising American and Chinese influence in the region.
What Southeast Asia Thinks About China & the U.S.
This was originally posted on our Voronoi app. Download the app for free on iOS or Android and discover incredible data-driven charts from a variety of trusted sources.
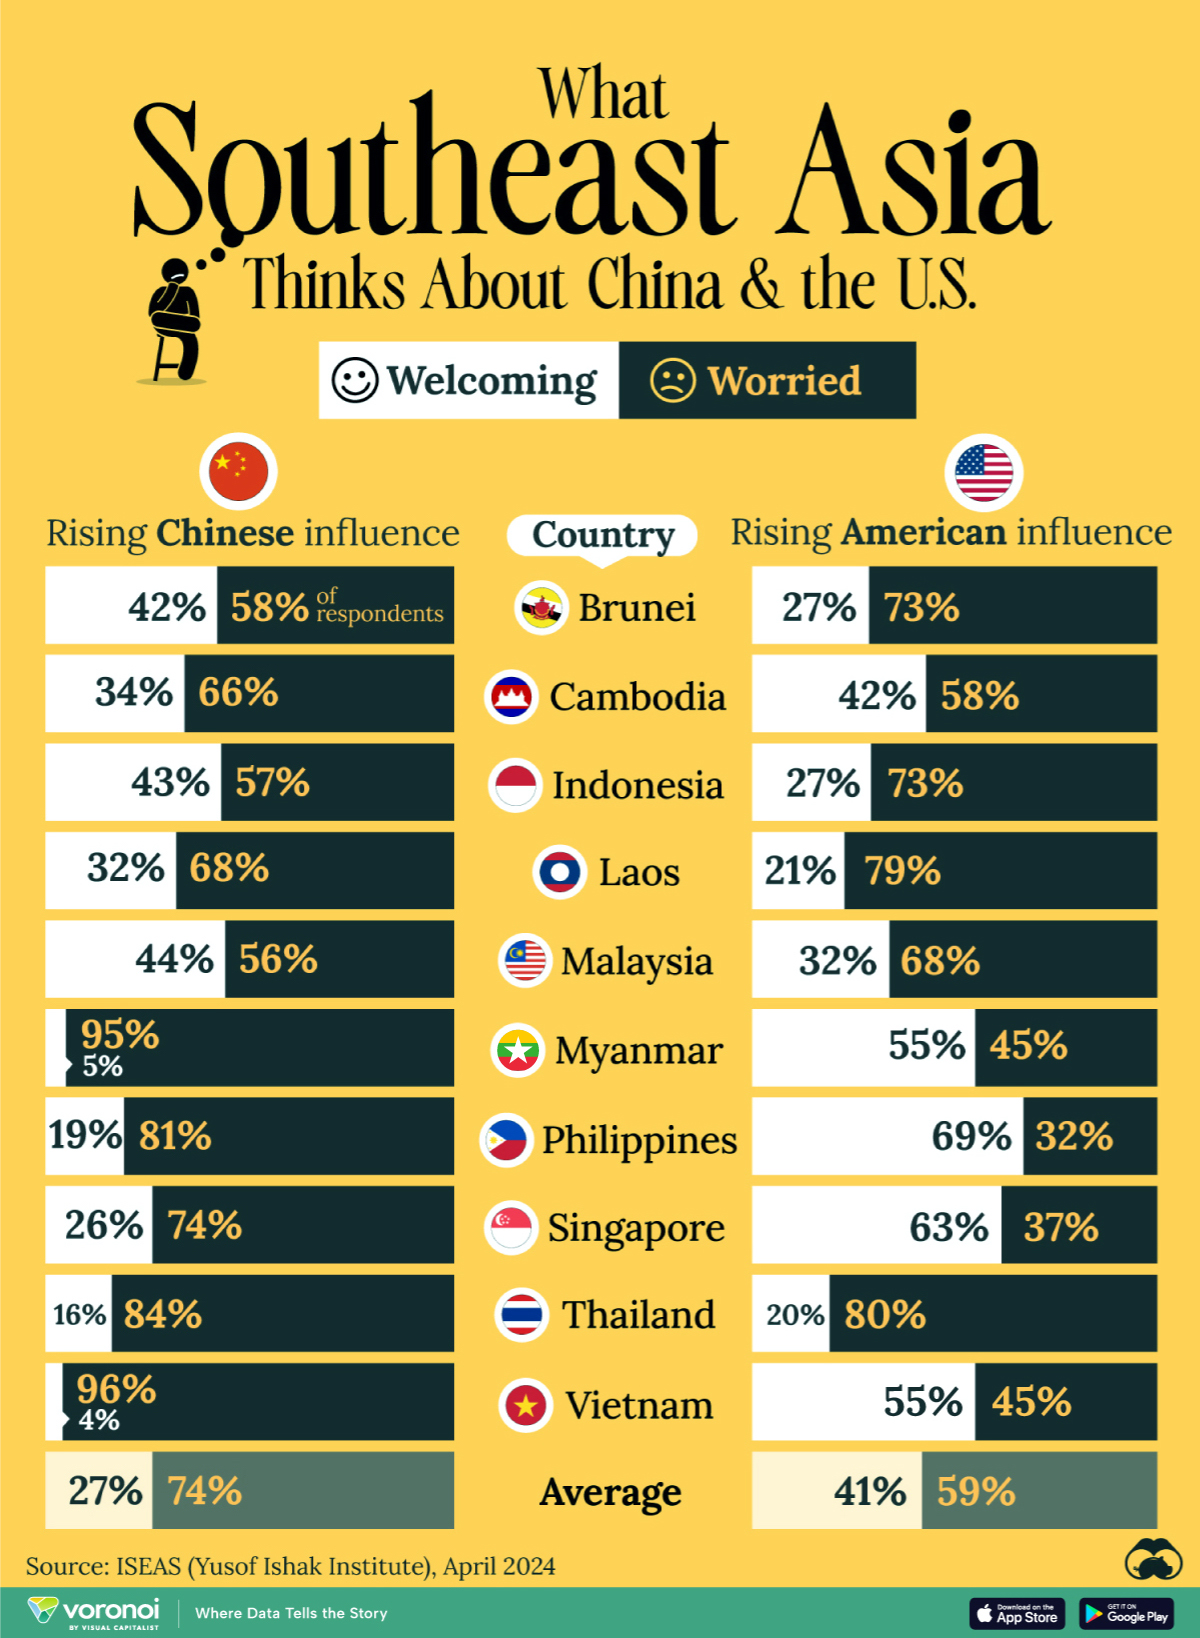
This chart visualizes the results of a 2024 survey conducted by the ASEAN Studies Centre at the ISEAS-Yusof Ishak Institute. Nearly 2,000 respondents were asked if they were worried or welcoming of rising Chinese and American geopolitical influence in their country.
The countries surveyed all belong to the Association of Southeast Asian Nations (ASEAN), a political and economic union of 10 states in Southeast Asia.
Feelings Towards China
On average, a significant share of respondents from all 10 countries are worried about rising influence from both the U.S. and China.
However, overall skepticism is higher for China, at 74% (versus 59% for U.S.).
| Country | Worried About Growing 🇨🇳 Influence | Welcome Growing 🇨🇳 Influence |
|---|---|---|
| 🇧🇳 Brunei | 58% | 42% |
| 🇰🇭 Cambodia | 66% | 34% |
| 🇮🇩 Indonesia | 57% | 43% |
| 🇱🇦 Laos | 68% | 32% |
| 🇲🇾 Malaysia | 56% | 44% |
| 🇲🇲 Myanmar | 95% | 5% |
| 🇵🇭 Philippines | 81% | 19% |
| 🇸🇬 Singapore | 74% | 26% |
| 🇹🇭 Thailand | 84% | 16% |
| 🇻🇳 Vietnam | 96% | 4% |
| Average | 74% | 27% |
The recently-cooled but still active territorial concerns over the South China Sea may play a significant role in these responses, especially in countries which are also claimants over the sea.
For example, in Vietnam over 95% of respondents said they were worried about China’s growing influence.
Feelings Towards America
Conversely, rising American influence is welcomed in two countries with competing claims in the South China Sea, the Philippines (69%) and Vietnam (55%).
| Country | Worried About Growing 🇺🇸 Influence | Welcome Growing 🇺🇸 Influence |
|---|---|---|
| 🇧🇳 Brunei | 73% | 27% |
| 🇰🇭 Cambodia | 58% | 42% |
| 🇮🇩 Indonesia | 73% | 27% |
| 🇱🇦 Laos | 79% | 21% |
| 🇲🇾 Malaysia | 68% | 32% |
| 🇲🇲 Myanmar | 45% | 55% |
| 🇵🇭 Philippines | 32% | 69% |
| 🇸🇬 Singapore | 37% | 63% |
| 🇹🇭 Thailand | 80% | 20% |
| 🇻🇳 Vietnam | 45% | 55% |
| Average | 59% | 41% |
Despite this, on a regional average, more respondents worry about growing American influence (59%) than they welcome it (41%).
Interestingly, it seems almost every ASEAN nation has a clear preference for one superpower over the other.
The only exception is Thailand, where those surveyed were not a fan of either option, with 84% worried about China, and 80% worried about the U.S.

-

 Culture6 days ago
The World’s Top Media Franchises by All-Time Revenue
-

 Science2 weeks ago
Visualizing the Average Lifespans of Mammals
-

 Brands2 weeks ago
How Tech Logos Have Evolved Over Time
-

 Energy2 weeks ago
Ranked: The Top 10 EV Battery Manufacturers in 2023
-

 Countries2 weeks ago
Countries With the Largest Happiness Gains Since 2010
-

 Economy2 weeks ago
VC+: Get Our Key Takeaways From the IMF’s World Economic Outlook
-

 Demographics2 weeks ago
The Countries That Have Become Sadder Since 2010
-

 Money1 week ago
Charted: Who Has Savings in This Economy?