Markets
Stock Market Returns Over Different Time Periods (1872-2018)
Putting hard-earned money in the stock market can make some people nervous.
It’s well known that a correction can occur at any time, and the fear of market crashes can make even the most seasoned investors to make questionable decisions.
While it’s true that putting your money on the line is never easy, the historical record of the stock market is virtually irrefutable: U.S. markets have consistently performed over long holding periods, even going back to the 19th century.
Market Performance (1872-2018)
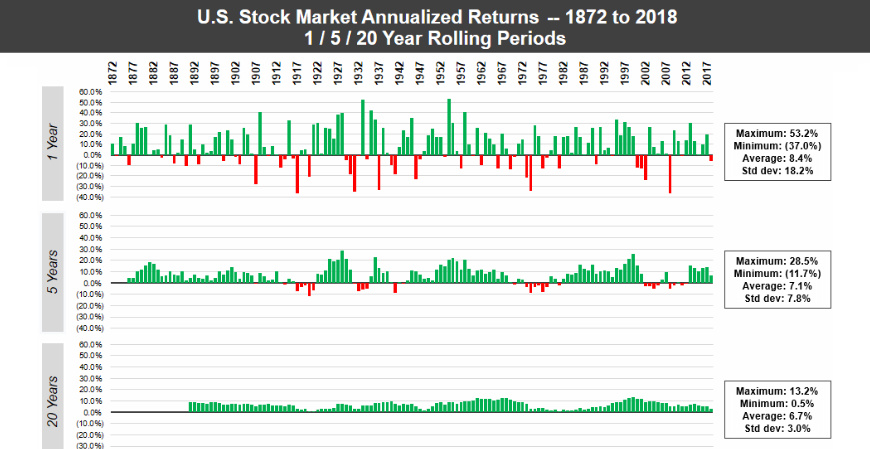
Today’s animation comes to us from The Measure of a Plan, and it shows the performance of the U.S. market over different rolling time horizons using annualized returns.
Note: The animation uses real total returns from the S&P Composite Index from 1872 to 1957, and then the S&P 500 Index from 1957 onwards. Data has been adjusted for reinvestment of dividends as well as inflation.
Using just one-year intervals of time, the market can be a crapshoot. Unfortunately, if you were to just choose a one-year period at random, there would be a significant chance of losing money.
However, as the timeframes get longer – the animation goes to 5-year, 10-year, and then 20-year rolling periods – the frequency of losses rapidly decreases. By the time you get to the 20-year windows, there isn’t a single instance in which the market had a negative return.
Why Time Matters
Over 146 years of data, the chance of seeing negative returns for any given year is about 31%.
That fact in itself is quite alarming, but even more important to note is the distribution of returns in those down years. As you can see in the following chart also from The Measure of a Plan, it’s not uncommon for a down year to skew in the high negatives, just as it did during the crisis of 2008:
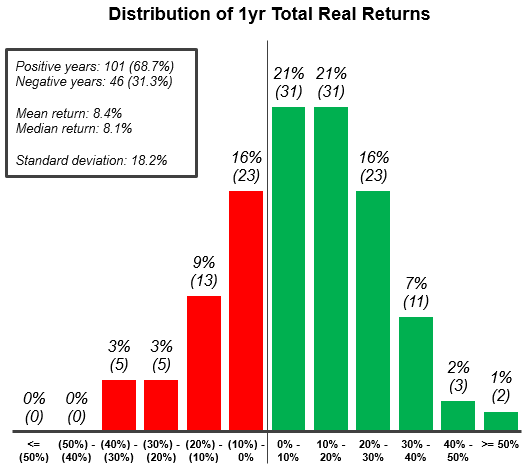
According to the data, there have been 10 individual years where the market has lost upwards of 20% – and while those off years are greatly outnumbered by the years with positive returns, it makes it clear that timeframe matters.
Past performance obviously doesn’t guarantee future results, but the historical track record in this case is quite robust.
Long-term investors can see that as long as their time horizon is measured in the decades, you can take the odds of making money in the stock market to the bank.


Markets
Visualized: Interest Rate Forecasts for Advanced Economies
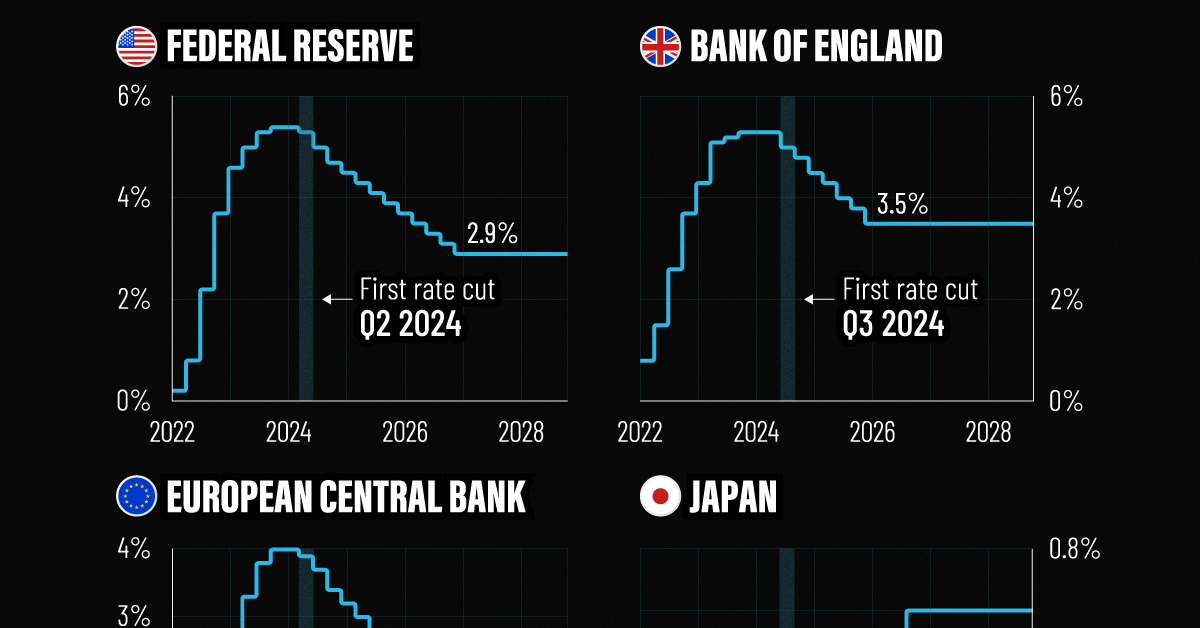
In this graphic, we show the IMF’s interest rate forecast for the U.S., Europe, the UK, and Japan for the next five years ahead.
Interest Rate Projections for Advanced Economies
While U.S. inflation cooled in the second half of last year, price pressures returned in 2024, leading investors to rethink how soon central bankers will cut rates.
Despite the recent increase, the interest rate forecast for many economies looks optimistic, thanks to subdued energy price shocks and abating supply chain disruptions. Still, short-term risks remain, including persistently high services inflation clouding the outlook.
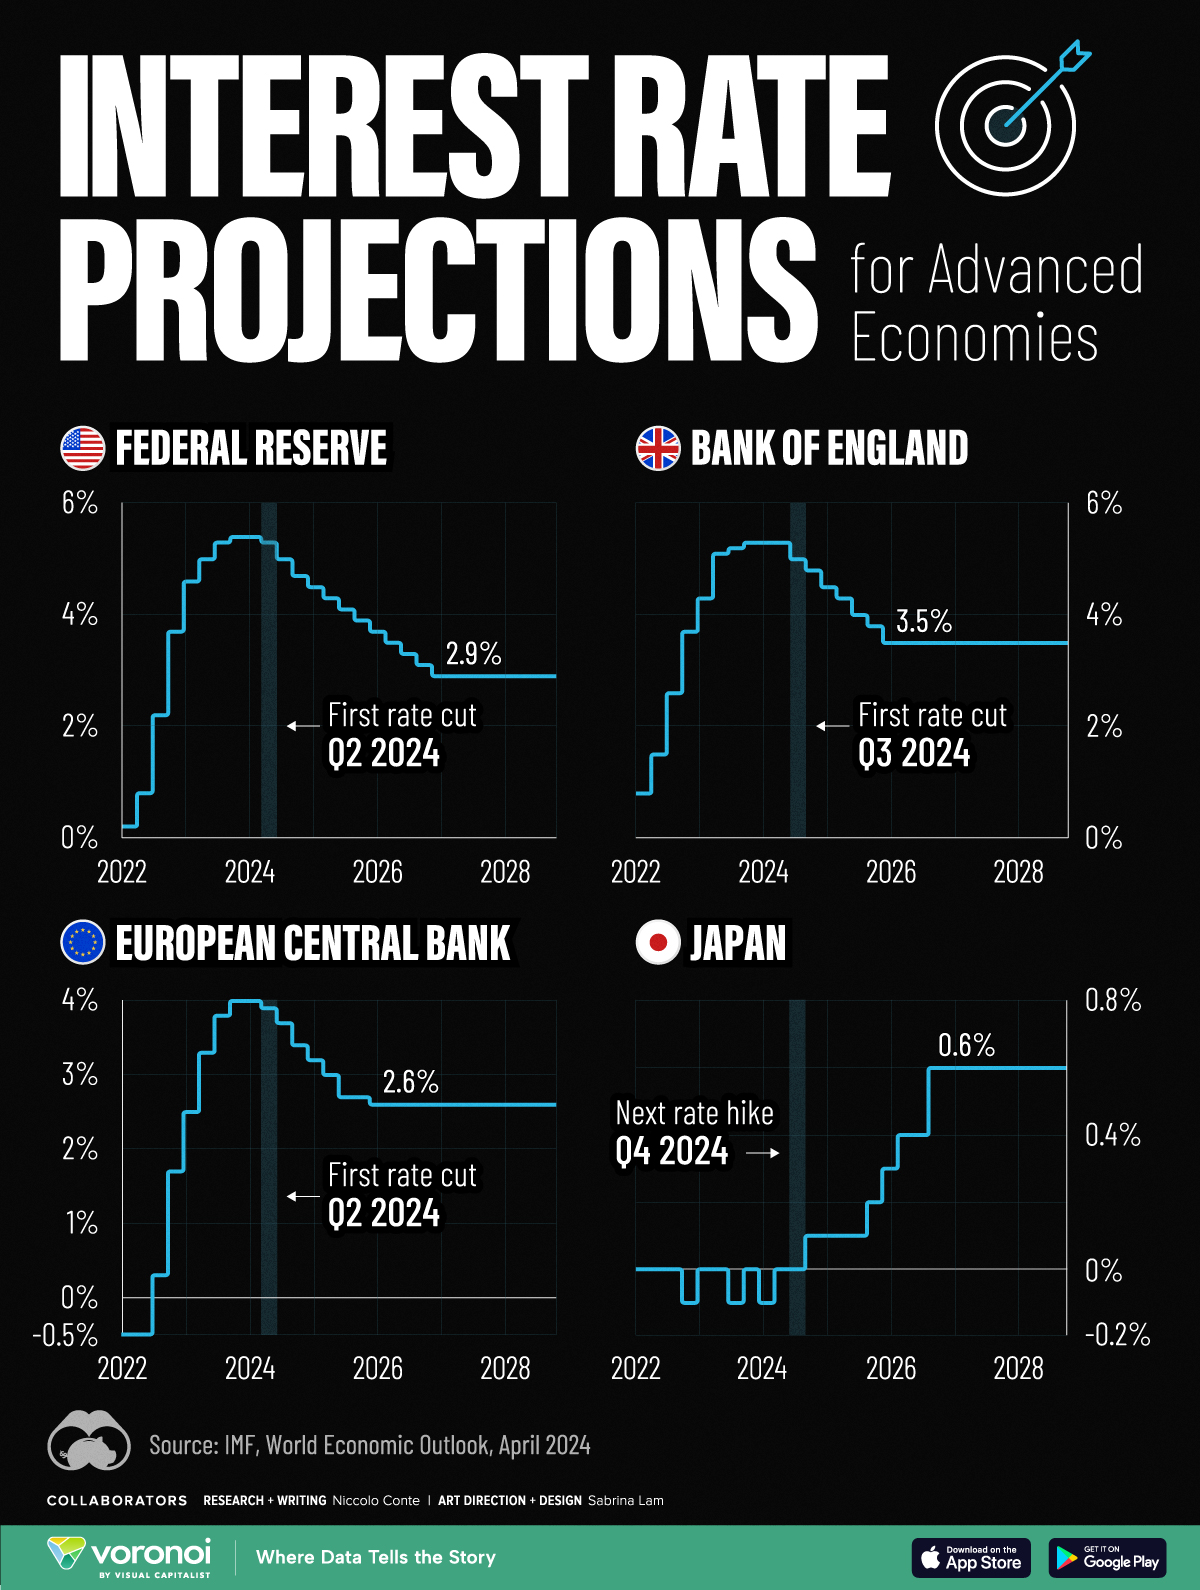
This graphic shows the interest rate forecast for advanced economies, based on the International Monetary Fund’s (IMF) 2024 World Economic Outlook.
Get the Key Insights of the IMF’s World Economic Outlook
Want a visual breakdown of the insights from the IMF’s 2024 World Economic Outlook report?
This visual is part of a special dispatch of the key takeaways exclusively for VC+ members.
Get the full dispatch of charts by signing up to VC+.
A Closer Look at the IMF Interest Rate Forecast
Below, we show the projected path of interest rates based on the IMF’s latest data:
| Federal Reserve | Bank of England | ECB | Bank of Japan | |
|---|---|---|---|---|
| Q1 2024 | 5.4% | 4.0% | -0.1% | 5.3% |
| Q2 2024 | 5.3% | 3.9% | 0.0% | 5.3% |
| Q3 2024 | 5.0% | 3.7% | 0.0% | 5.0% |
| Q4 2024 | 4.7% | 3.4% | 0.1% | 4.8% |
| Q1 2025 | 4.5% | 3.2% | 0.1% | 4.5% |
| Q2 2025 | 4.3% | 3.0% | 0.1% | 4.3% |
| Q3 2025 | 4.1% | 2.7% | 0.1% | 4.0% |
| Q4 2025 | 3.9% | 2.7% | 0.2% | 3.8% |
| Q1 2026 | 3.7% | 2.6% | 0.3% | 3.5% |
| Q2 2026 | 3.5% | 2.6% | 0.4% | 3.5% |
| Q3 2026 | 3.3% | 2.6% | 0.4% | 3.5% |
| Q4 2026 | 3.1% | 2.6% | 0.6% | 3.5% |
| Q1 2027 | 2.9% | 2.6% | 0.6% | 3.5% |
| Q2 2027 | 2.9% | 2.6% | 0.6% | 3.5% |
| Q3 2027 | 2.9% | 2.6% | 0.6% | 3.5% |
| Q4 2027 | 2.9% | 2.6% | 0.6% | 3.5% |
| Q1 2028 | 2.9% | 2.6% | 0.6% | 3.5% |
| Q2 2028 | 2.9% | 2.6% | 0.6% | 3.5% |
| Q3 2028 | 2.9% | 2.6% | 0.6% | 3.5% |
| Q4 2028 | 2.9% | 2.6% | 0.6% | 3.5% |
As we can see, the U.S. is forecast to see its first rate cut in the second quarter of 2024.
Broadly speaking, rates will be cut very gradually, with two additional rate cuts anticipated for this year. By 2027, interest rates are projected to fall to 2.9% after a series of moderate rate cuts as inflation dissipates.
Like the U.S., the European Central Bank is forecast to cut rates in the second quarter of 2024, with rates set to fall to 2.6% by 2026. While inflation has cooled at a faster rate across Europe compared to the U.S., GDP growth is also projected to be more muted. This year, the IMF projects that GDP across the euro area will increase just 0.8% versus 2.7% for the U.S. economy.
In the UK, monetary easing is projected to move more gradually, with the first cut projected for the third quarter of this year. Growth across the UK economy is projected to be tepid for 2024, weighed down by the impact of higher rates, lower productivity, and sluggish investment growth.
Rates Rising Slowly in Japan
After years of enduring negative interest rates, Japan raised its short-term policy rate to 0.0-0.1% in March 2024.
This was due in part to a promising inflation outlook over the coming years. The IMF projects that the next rate hike will take place in the fourth quarter of 2024, as it moves away from a multi-decade battle with deflation.
Get the Full Analysis of the IMF’s Outlook on VC+
This visual is part of an exclusive special dispatch for VC+ members which breaks down the key takeaways from the IMF’s 2024 World Economic Outlook.
For the full set of charts and analysis, sign up for VC+.

-

 Wealth6 days ago
Charted: Which City Has the Most Billionaires in 2024?
-

 Mining2 weeks ago
Gold vs. S&P 500: Which Has Grown More Over Five Years?
-

 Uranium2 weeks ago
The World’s Biggest Nuclear Energy Producers
-

 Education2 weeks ago
How Hard Is It to Get Into an Ivy League School?
-

 Debt2 weeks ago
How Debt-to-GDP Ratios Have Changed Since 2000
-

 Sports2 weeks ago
The Highest Earning Athletes in Seven Professional Sports
-

 Science2 weeks ago
Visualizing the Average Lifespans of Mammals
-

 Brands1 week ago
How Tech Logos Have Evolved Over Time