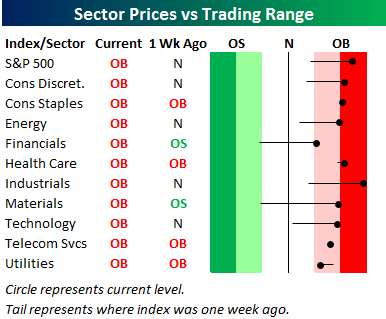
 In Thursday’s Sector Snapshots report, we included the chart to the right showing that the S&P 500 and all ten sectors were trading at overbought levels (more than one standard deviation above 50-day moving average). As mentioned in the report, it’s not too common that you see all ten sectors rallying at the same time like they have in the last several days. The last time we saw a similar set up was earlier this year in March. With all ten sectors trading at overbought levels, it would make sense to expect some short-term consolidation as equities catch their breath and let their trading ranges catch up to them. This type of consolidation can either occur in the form of lower prices or time (sideways trading).
In today’s Chart of the Day sent to paid subscribers, we provided a list of 24 prior periods since 1990 where all ten sectors traded to overbought levels simultaneously after not having done so in the prior three months. Included is a summary of how the S&P 500’s performance over the following week, month, and quarter. To view it, please start a 14-day free trial below.
