Economists have had a lot of interest recently in whether uncertainty itself may have measurable effects on the economy. Last week I participated in a session devoted to economic research on this question at the meetings of the Allied Social Science Association in Chicago. Here I relate some of the comments I made there.
Economists usually describe the uncertainty of a random variable in terms of its variance, which is a measure of the dispersion of the possible outcomes. We often think of higher uncertainty as something that increases the variance without changing the mean, or average, outcome. Something very good may be about to happen, or something very bad, but I’m not sure which.
However, a more vernacular usage of the word “uncertainty” has pure negative connotations, referring to a higher probability that something bad may happen, without anything in the way of upside. One of the points I made in Chicago is that there is a mathematical sense in which this alternative interpretation of uncertainty could in fact be the reason that the variance as normally defined would increase.
I drew as an example on one mathematical description of economic recessions. Suppose that if we turn out to be in a recession next quarter, we could think of GDP growth in that case as coming from a Normal distribution with mean m1 and variance s2. For example, in historical data the average growth rate in recessions is m1 = -1% at an annual rate with a variance s2 around that mean of 10%. By contrast, the average growth rate in U.S. expansions was around m2 = +4%, with a variance around that mean likewise around 10%. We don’t know today whether we’re going to be in a recession next quarter or not. If there’s a probability p of being in recession, it’s not hard to show that the expected growth rate for next quarter is (p)(m1) + (1-p)(m2) (a weighted average of the two means) and that the variance around that expected growth is s2 + p(1-p)(m1 – m2)2. If we’re in a normal expansion right now, there’s only a p = 5% chance that we’ll go into recession next quarter, corresponding to a variance of 10 + (0.05)(0.95)(-1 – 4)2 = 11.2. The remote possibility of a recession in that case is contributing very little to the variance. An increase in s2 to say 15 would increase the variance of GDP growth from 11.2 to 16.2. This is the kind of pure uncertainty shock that economists often imagine, something that increases the dispersion in both expansions and recessions without changing the mean.
On the other hand, if something happened that made us think the probability of recession next quarter has gone from 5% up to 50%, this also turns out to be something that would increase the variance from 11.2 to 10 + (0.5)(0.5)(-1 – 4)2 = 16.2. The second kind of news has not only increased the variance, it also lowered the mean from (0.05)(-1) + (0.95)(4) = 3.75 to (0.5)(-1) + (0.5)(4) = 1.5. In this case, the event that increased uncertainty (in the sense of raising the variance of the distribution) was unambiguously bad news.
One measure of uncertainty that economists sometimes look at is the VIX, which is a measure of the square root of the variance of next month’s stock returns as inferred by the prices of stock options that will pay off if there is a big change up or down. From the above calculations, the VIX would be expected go up if either s2 increases or if the probability of recession gets closer to one-half. Here is a plot of the VIX, taken from an influential paper by Stanford economist Nicholas Bloom. As Johns Hopkins Professor Jonathan Wright, who was another discussant at the ASSA section, observed, the spikes up in the VIX correspond mainly to events that look very much like bad news and very little like pure dispersion shocks. Jonathan also noted that risk aversion by stock market participants might make the “bad news” element in a measure like the market-based VIX even stronger.
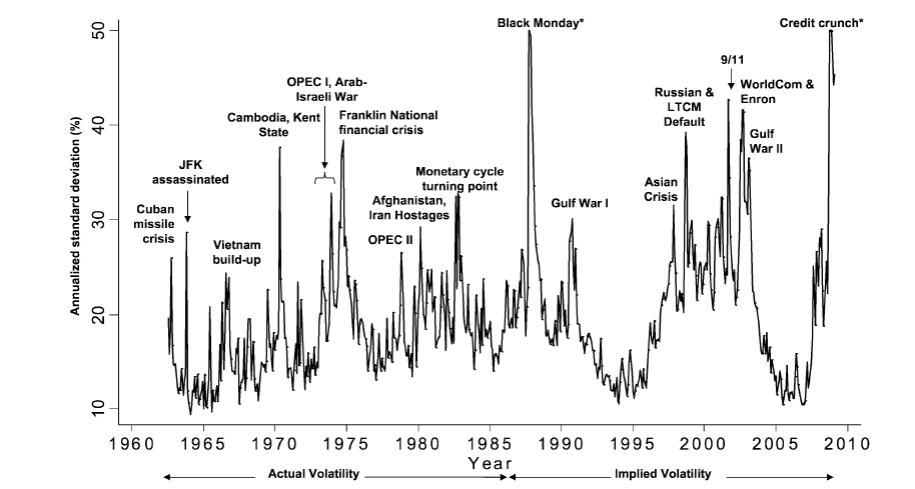
Source: Bloom (2009).
Another popular measure used by researchers is the Economic Policy Uncertainty Index developed by Scott Baker, Nicholas Bloom, and Stephen Davis. This is based on a scan of articles in leading newspapers looking for combinations of the following terms: (1) “uncertainty” or “uncertain”; (2) “economic” or “economy”; and (3) one of the following policy terms: “congress”, “deficit”, “Federal Reserve”, “legislation”, “regulation” or “white house”. Below is a graph of that index, in which I’ve made annotations for what seem to be some of the key developments.
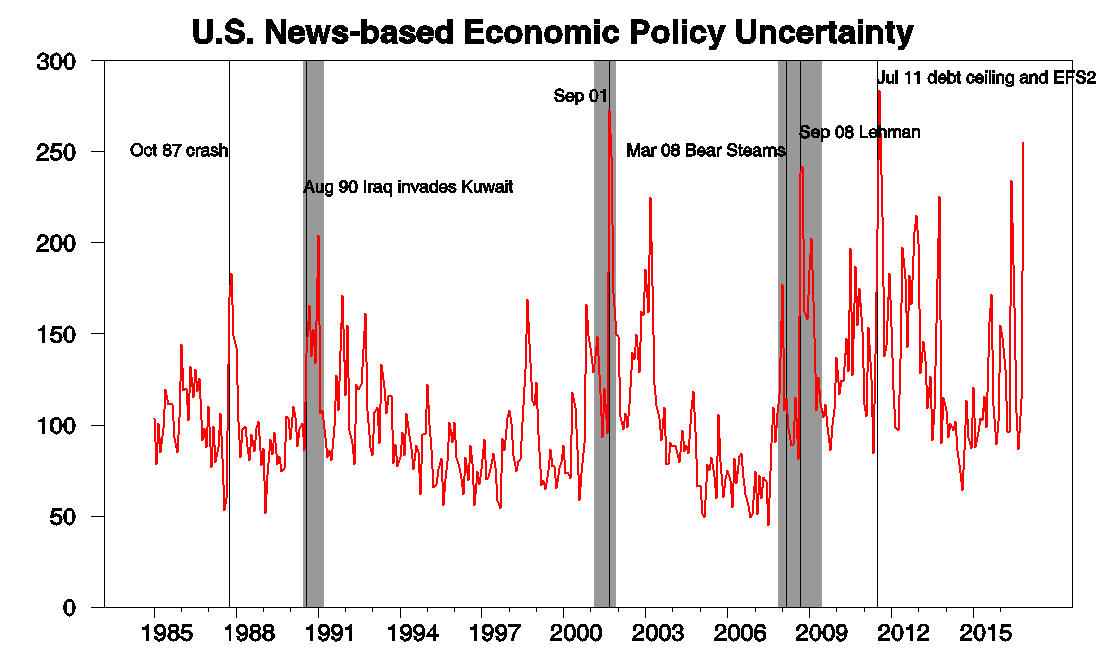
The first date that really stands out is October 1987, associated with the stock market crash. Nobody would have viewed that as an increased probability that either something good or something bad might happen. It was instead a pure increased probability of something bad, though those worries in that case turned out not to be realized. When Iraq invaded Kuwait in August 1990, that again was an event that increased the probability of something bad happening, and in this case something bad definitely did occur, with the spike in oil prices being one factor that likely contributed to the recession of 1990-91. September 11, 2001 was likewise a pure increase in the probability of bad things happening, as I would argue was also the case for the financial turmoil associated with the Great Recession. The one seemingly clean example of a pure “policy uncertainty shock” might be the debt-ceiling showdown in July 2011, in which Congress played with the idea that the U.S. might default on some debt obligations. This was surely a self-inflicted gunshot wound if there ever was one. Even so, we might have equally well labeled a key event of that month being the expansion of the European Financial Stability Facility, which was a response to the very real debt crises in Greece and other European countries. The subsequent grandstanding by U.S. politicians might be understood in part as a (completely misguided) response to the problems in Europe.
Here to me then is the most natural interpretation of the Economic Policy Uncertainty Index. At times there is a dramatic exogenous event that increases the probability that something bad will happen to the economy. Congress and the President talk about taking some kind of action in response, though nobody is sure what that response is going to be. It likewise is much less clear what course the Federal Reserve will take in response to the events. Sometimes something bad indeed does happen in the wake of those events, just as everyone feared, and despite whatever policy did or did not do. Even if we have a pure and exact measure of the object of interest– uncertainty about economic policy– it is not valid to conclude that policy uncertainty per se was the cause of the subsequent poor economic performance.
There is much recent research that tries to get at these questions in other ways. For example, Alfaro, Bloom, and Lin (2016) look at how firms differ in their exposure to different kinds of shocks such as energy prices, exchange rates, and economic policy and uses the cross-section along with time-series correlations to try to draw conclusions about the effects of uncertainty.
But even so, the case that a pure increase in uncertainty itself has significant economic effects, as distinct from some confusion about policy whenever there is an increased probability that something bad is about to happen to the real economy no matter what policy does, is far from settled.
Excellent. Though I could not help thinking that you were using ‘uncertainty’ the way others would use the term ‘risk’. If it can be captured with an estimate of variance, then it is ‘risk’ not uncertainty.
To get back to ‘uncertainty’ as a popular term that captures sentiment in the face of an anticipated negative shock, suppose there is a low, near zero probability of a large positive windfall. Then agents receive information that suggests that windfall event might actually happen, i.e., the probability goes up.
The variance increases but agents are observed to disregard the second and other moments (to keep things simple). Will agents start to leverage and risk-manage around the expected windfall? Assume they find market counterparts to do so. The economic impact should be positive prior to the windfall materializing.
Even if the windfall fails to materialize, the added economic activity could contribute to improved economic confidence so the beneficial impacts endure even if the windfall does not materialize.
That intuitive story has something in common with the notion of policy makers tricking agents into desired, presumably better outcomes.
Might be of interest – I made an index of ‘liquidity’ words and created an index of using The Economist newspaper. The index follows the VIX fairly well. Maybe uncertainty is related to ‘liquidity’ in some way.
http://scweiss.blogspot.com/2016/06/economist-liquidity-index.html
Economists usually describe the uncertainty of a random variable in terms of its variance
In my world (operations research) “uncertainty” is usually taken to mean non-quantifiable risk, which is different from variance. Variance is a quantifiable risk. With uncertainty we don’t even have a good sense of what the first moment is, never mind higher moments.
About 10 years ago one of my colleague’s and I did a study and found conditional volatility models did a pretty good job of predicting turning points in sales data.
Precisely 2slugbaits.
All this recalls the way some prestigious economists constantly use ‘demand’ and ‘consumption’ as synonyms.
I get it when the business press does that. I get it when Neo-Marxists deploying Input-Output models do that. Otherwise, I don’t understand the sloppiness except the whole notion of latent variables as evoked by ‘demand’ and ‘supply’ is complex, hard to communicate and may spur additional ‘uncertainty’. Sorry, I could not resist.
The VIX is negatively correlated with S&P500 returns – i.e. higher levels of the VIX are associated with negative S&P500 returns. It’s not an insignificant correlation either. It is also positively correlated with credit spreads and measures of bank stress. It is not an insignificant relationship either. There is a natural fundamental relationship between negative equity returns and higher VIX, because market participants buy put options to hedge, driving up the VIX. So, it is almost literally true that higher stock market variance is associated with negative equity returns. (Negative) equity returns can be a leading indicator of recessions.
I would not say that “economists sometimes look at is the VIX” – this is quite an understatement! In fact, it is so commonly used that regulators bake an increase in the VIX into bank stress tests as one of the key variables (key variables also include unemployment, BBB credit spreads, treasuries, equities, inflation, and GDP growth see here for example, “Market Volatility Index”: https://www.federalreserve.gov/bankinforeg/stress-tests/2016-supervisory-scenarios-for-annual-stress-tests-variables-considered-in-scenarios.htm ). The VIX is quite commonly used as a leading indicator of recessions, like equity returns, along with the flatness/steepness of the treasury curve (e.g. 10yr-2yr spread) and some other things.
I have also seen the Economic Policy Uncertainty Index (EPUI) used in presentations as indicators, but less so. People get a lot of news these days over social media. There are a lot of news sources not included or not searched. I do not put a lot of stock in the EPUI, because of new media. It’s also hard to know how “policy uncertainty” shows up in media, and what terms to search for.
I think that the catch in this analysis though is 1-separating cause/effect, and 2-separating policy uncertainty from ordinary economic uncertainty. If the VIX is up, and equities down, there is a higher recession probability. But – is that because the causality runs from higher VIX to higher recession probability? Or is it because a new quantum of information has arrived (economic data) that leads market participants to raise their recession probability and simultaneously discount equities and corporate bonds (and: buy downside equity protection in the form of puts, leading to a higher VIX). It is far more likely the causality runs from new information->higher VIX, lower equities, higher recession probability. Regulators include the VIX in stress tests, not necessarily because causality runs from the VIX to recession, but because a lot of internal financial models use the VIX as a proxy variable to drive other variables associated with stress/recession.
The VIX is probably a good indicator of ordinary economic uncertainty, but not of true policy uncertainty. By policy uncertainty, I mean the actual probability of legislative changes. I am not sure this is even a well defined concept, and I have my doubts that this is anything more than an “I know it when I see it” metric. True policy uncertainty (measured as the actual probability of a significant change in regulatory direction or new legislative/regulatory initiatives) was lower over the 2nd half of Obama, than it will be over the first half of Trump. Obama faced a divided congress and was limited as to what he could do. He tried, but even got shot down by the Supreme Court a record 40+ times. Despite all the media hype, not much got done. I do not consider that “uncertain.” A reasonable person would have concluded the 2nd 4 years were similar to the first. Trump on the other hand, has a unified GOP congress, and will change a whole bunch of stuff. Nobody has any idea har far he will go. No one even knows – just as one example – what will replace the Obamacare. I would say policy uncertainty went up an order of magnitude Nov 9th, 2016, at least. Yet: equities are up, the VIX is down (the VIX hit a local peak of 22.5 on Nov 4th, 2016 and is down to 11.5, see https://fred.stlouisfed.org/series/VIXCLS/ ), and growth forecasts are up.
I have no problem interpreting the VIX as an indicator of economic uncertainty, but I cannot interpret the VIX as policy uncertainty. Nor does it seem that I could conclude, at least based on the last few months, that policy uncertainty=economic uncertainty. If anything, the events over the last few months reinforce the idea that the direction of change matters more than the variance of change (Or perhaps the direction of the change is first order, the uncertainty is a second order effect).
Maybe what people really meant during the Obama years was not that “policy uncertainty” was the actual culprit of slow growth. Maybe what people meant was “We have no idea how bad it’s going to get (but we are sure it’s going to be bad)”
Thanks a lot, Trump would say ‘great’.
Beside all this uncertainty:
I bet they will be coming out with a new law for fact checking in the media.
Will be done by the Ministry of Truth.
That will be the time James, to change your name from ‘James D. Hamilton’ into
‘Winston Smith’.